history Filed 04 · 04 16 min WR-FCT-003 ERASED thread
REDLINE
When the bank learned to read Black life as danger
The map looked calm. The decades after it did not.
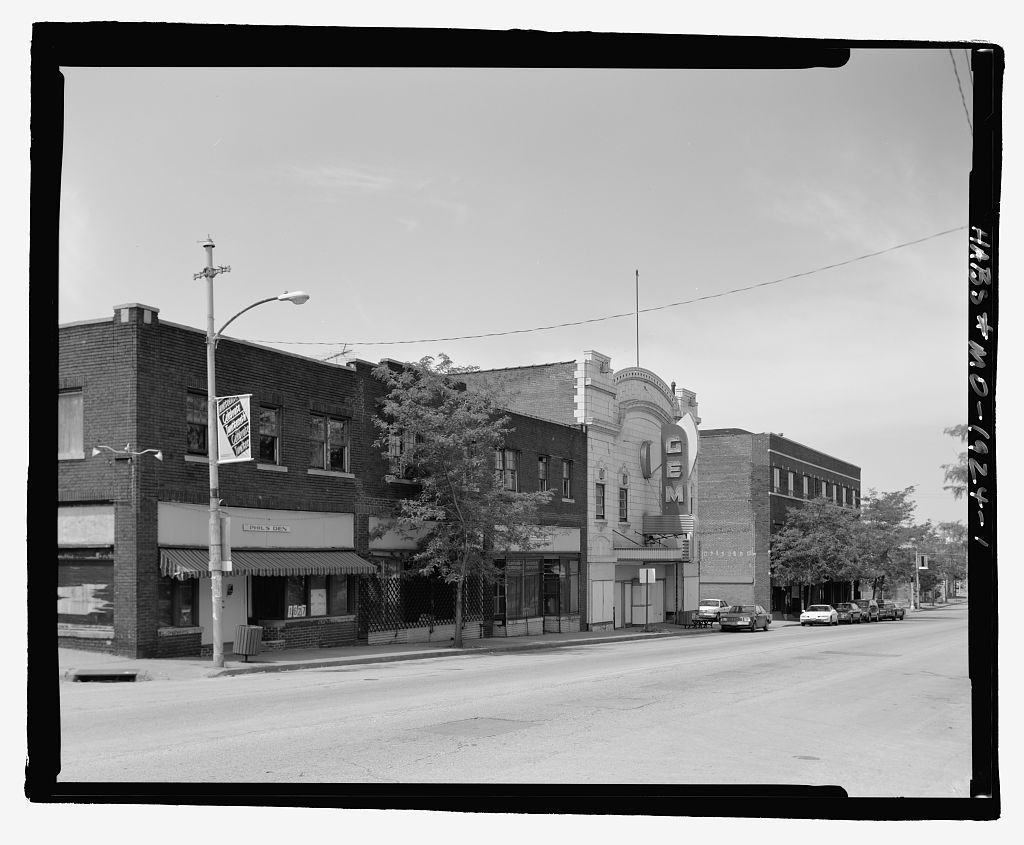
Every new file, the day it is filed.
Nobody burned the block.
They just agreed it was worth less.
That is what makes redlining so precise. It moved the violence upstream. Off the street. Into the office. Into the form. Into the signature at the bottom of the appraisal that used the word residential security like it wasn’t a verdict.
The map looked calm. The decades after it did not.
Before the bulldozer arrives, before the freeway trench opens up the middle of a neighborhood like a chest wound, before the press release about revitalization, there was the survey.
A neighborhood. A grade. A color.
Someone sat in a room and decided which blocks were stable and which ones were trouble. The form had a line headed Negro, and they filled it in. They also said declining. They said detrimental influences. They said infiltration.
What the language actually meant was: money will not follow these people. The cards described the buildings, and they counted the Black residents as part of the risk.
That is the part that still doesn’t get said plainly enough.
The decline got blamed on the people who absorbed the judgment.
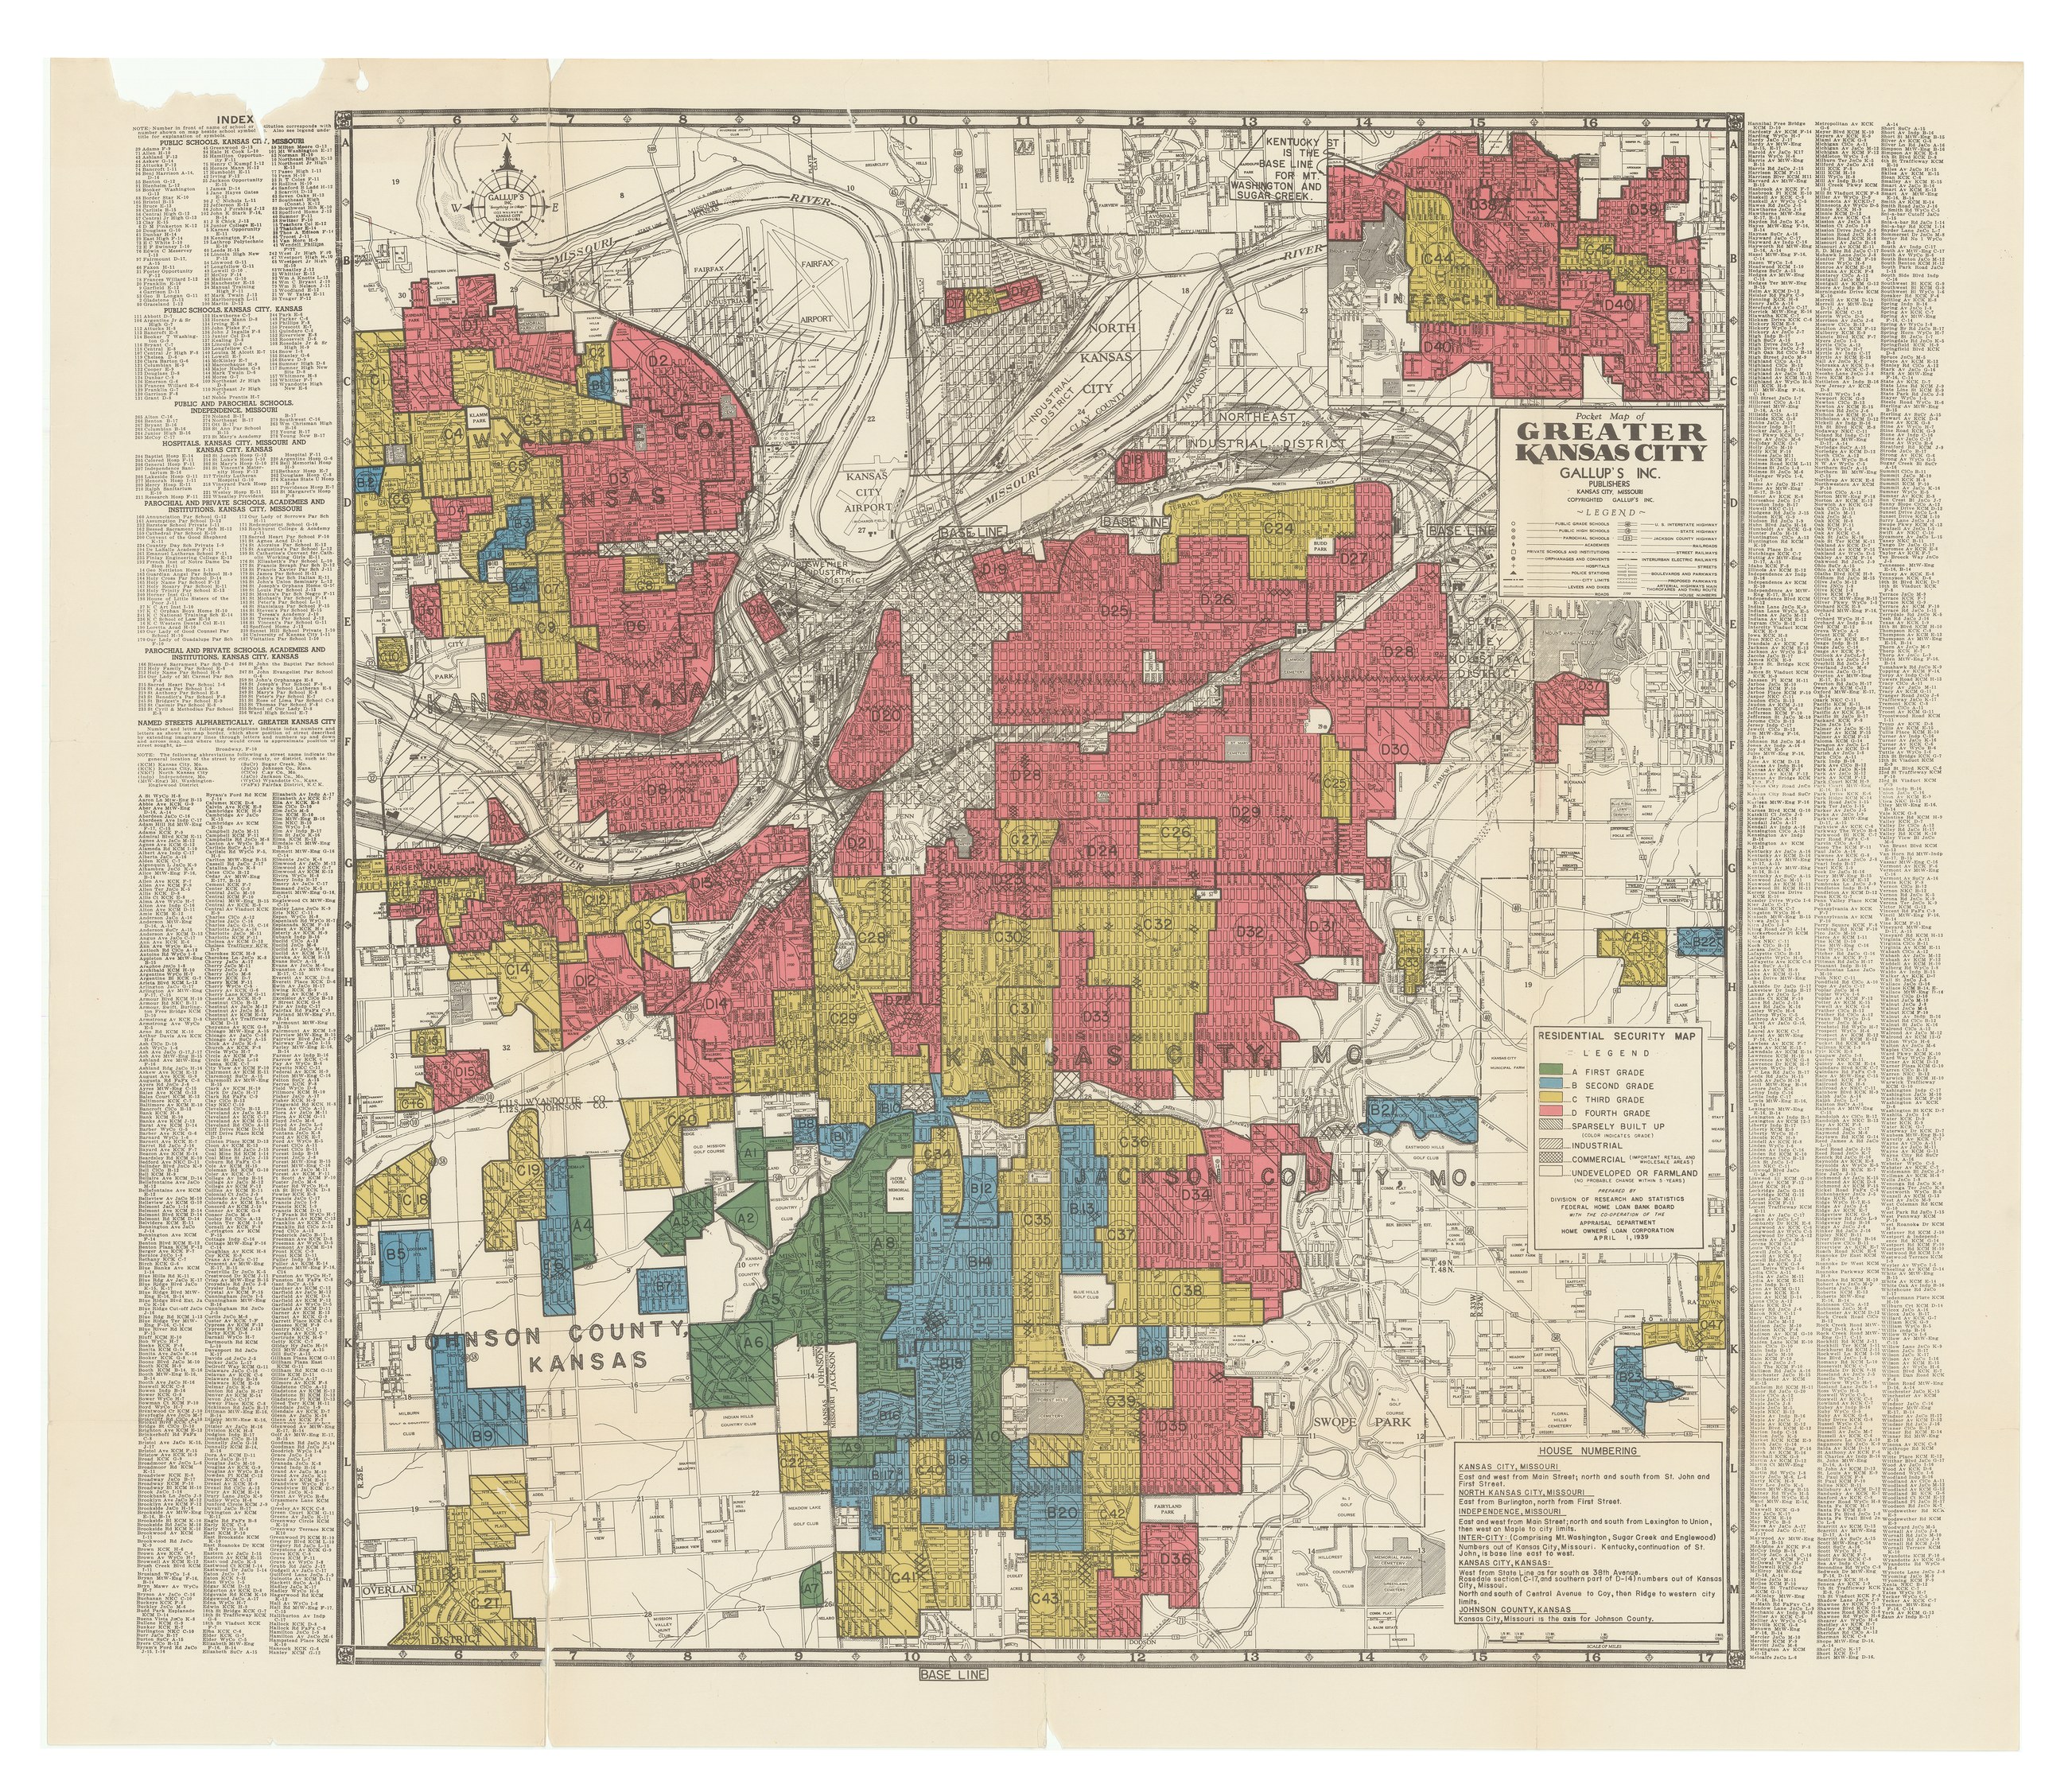
The Residential Security Map of Greater Kansas City, 1 April 1939. Home Owners’ Loan Corporation, Federal Home Loan Bank Board. Base map: Gallup’s Inc., Kansas City, Missouri. Record Group 195, City Survey Files, National Archives, NAID 326752026. Access: Unrestricted. Use: Unrestricted.
In Kansas City, the pattern was not subtle. It was administrative.
HOLC neighborhood grading arrived in the 1930s and wrote the judgment down, block by block. Across the cities they studied, on the lower-graded side of the lines, homeownership, house values and rents fell behind for decades, economists Daniel Aaronson, Daniel Hartley and Bhashkar Mazumder found. Price Fishback and three colleagues, working from 1930s loan records in Baltimore, Peoria and Greensboro, found that the FHA’s exclusion of low-income urban neighborhoods came before the maps, and that the HOLC itself lent in them and to Black homeowners.
Repairs stop happening. Landlords squeeze what they can from buildings nobody in power intends to save. Streets crack. Services thin out. Vacancy spreads and starts to look like character instead of consequence. Then the city comes back years later with a second vocabulary. Blight. Clearance. Public purpose. Urban renewal. The words are different but they’re doing the same work.
The line teaches the future how to talk.
So when someone asks how a neighborhood ends up that way, we should be honest about what question they’re actually asking. Ends up what way, exactly. Underfinanced. Underrepaired. Easy to condemn. Easy to route a freeway through. Easy to call a problem after you made it one.
That is not market wisdom.
That is reputational warfare with a filing cabinet.
Greater Kansas City — HOLC Residential Security Map — 1939
A map can look neutral right up until you follow what it did.
The Kansas City sequence is not hard to follow once you stop pretending the pieces are unrelated.
1942. The city approves Belvidere Hollow as parkland. What had been a Black community tied to Exoduster migration gets translated into green space. Not evolved. Erased.
1950s. Attucks gets cleared. Urban renewal. 600-plus families. 54 acres. Replacement housing arrives eventually. But even the better versions of redevelopment begin with somebody being removed. That part always gets soft-pedaled.
1951–2001. Highway 71. Fifty years of planning, property acquisition, and construction that destroyed roughly 2,000 homes and displaced thousands of Black residents. Today the official language calls this a need for reconnection. That is one of those words a city uses when it finally admits the cut was real.
Different decades. Same grammar.
The Mechanism — Kansas City Sequence
Grade
1930s–1940
Starve
Name
Clear
1942–2001
Redline the neighborhood. · Starve it. · Name the starvation. · Clear it. · Call the clearing progress. · Fund a reconnection study when the land is already speaking somebody else’s language.
Once the damage is visible, the explanation follows right behind it.
The housing was deteriorating.
The corridor needed investment.
The city had to act.
Always clean. Always too late. Always said by someone with no record of asking what produced the deterioration in the first place.
Decay is not the whole explanation for redlining.
Redlining helps produce what eventually gets called decay.
That is the trick. The system deepens the wound, then points at the scar as proof the neighborhood was weak.
We have heard this before.
Tulsa got fire and insurance denial.
Detroit got clearance and concrete.
Kansas City got maps and grades and acquisition orders.
Different costume. Same contempt.
Even so, in 1986 Highway 71 took the name of Bruce R. Watkins, who fought it.
And here is the sentence that makes people shift in their seat: a mob can burn a district in public. A credit regime can do the same work quietly and still call itself rational. One gets memorialized as hatred. The other gets taught as planning.
Which one do you think survives in polite company longer.
Home Owners’ Loan Corporation — Area Description — Greater Kansas City, 1939
Area
D-24 · Security Grade: Fourth
Negro
Few mixed
Shifting or Infiltration
Negro encroachment threatened from north
Repair
Fair to poor
Description and Characteristics of Area
Something of an “intermediate” fourth-grade district threatened with negro encroachment from the north, the colored section having extended to 27th Street east of The Paseo. It is a spotty section with many cheap bungalows and cheaply built 2-story structures, an area suffering from commercial encroachments in many spots. It is not free from the dirt and smoke from the railroad yards in the north. One favorable factor is the adequacy of the transportation, utilities, schools, and churches. There is very limited demand for property in the area but it is a fair rent district. A reasonably heavy tax assessment district.
Source: Home Owners’ Loan Corporation, Greater Kansas City Residential Security survey, area D-24 (1939). Mapping Inequality, Digital Scholarship Lab, University of Richmond.
The map did not reflect fear.
It organized it.
This is where the conversation turns current, and where everyone suddenly wants softer language.
I don’t.
18th and Vine is sacred ground. Music. Memory. Commerce. Cultural institution. A regional anchor with enough history on its back to carry a city’s whole story.
The archive says this: the district is now targeted for major reinvestment. Public infrastructure. A parking garage, open since May 2026. Museum expansion. Adjacent redevelopment. $400 million and more coming in. That is what the city’s page documents. What it does not name, and what this casefile puts on the table, is the other half: reinvestment on this scale carries real potential for cultural repair and, where the safeguards are weak, real pressure on the residents and legacy businesses still standing there.
Read that again.
Cultural repair. Pressure. Both at once.
That is the modern version of the sequence. The district gets celebrated. The people carrying the memory get priced out of the future the celebration is supposed to build. The mural survives. The rent doesn’t. The institution gets upgraded. The ecosystem thins.
Revival is not a synonym for justice.
Sometimes revival is just replacement with better branding.
Here is the sentence underneath everything above.
The map did not reflect fear.
It organized it.
It turned bias into a workflow. It gave prejudice an appraisal vocabulary, a color-coded legend, a mortgage logic, a planning language. It taught the country to read Black neighborhoods as financially suspicious, and then to mistake that suspicion for objective expertise.
That is what made the downstream damage feel respectable.
A freeway looks less like theft when the land beneath it has already been marked unstable. A clearance order feels less brutal when decades of red ink trained everybody to believe the block was failing. Paperwork does that. It launders intent.
On the Table
Kansas City first.
Where did the map hit before the machinery did. Which block got called risky before the project ever showed up. Which corridor got starved first and studied later. Which neighborhood got “improved” after the people who built it were already losing ground.
Outside KC: bring your city. Bring your district.
Name the mechanism. Name the paper. Name the word they used to make removal sound responsible.
If it’s anchored, Docket it.
If it’s still forming, put it on the table and we sharpen it together.
We are not building a comment section.
We are building the Archive.
Correction
Corrected 2026-07-21. This casefile attributed the phrase “adverse influences” to the HOLC survey. That is the wrong instrument. The Home Owners’ Loan Corporation area-description form used the field “Detrimental Influences.” “Adverse influences” is Federal Housing Administration language, from the section “Protection from Adverse Influences” in the FHA Underwriting Manual (1938, and earlier editions such as 1936). The highlighted term now reads “detrimental influences,” which is what the survey card said. The two words named two agencies running one machine. The essay’s other survey terms, “declining” and “infiltration,” were HOLC’s own and stand.
Corrected 2026-09-27. This essay published on February 15, 2025. One date is named here rather than quietly repaired.
The area description was misdated. The D-24 box above dated the card 1937, in both its header and its source line. In the Mapping Inequality transcription of the HOLC survey files, the record is dated February 1, 1939. Both now read 1939.
Source: Mapping Inequality, Digital Scholarship Lab, University of Richmond, area description data for Greater Kansas City, area D-24. Checked on September 27, 2026.
Corrected 2026-09-30. This casefile published on April 4, 2026. A reading of the whole casefile against its primaries found five more errors, named here rather than quietly repaired. The argument that the grade wrote a racial judgment into the record of a place stands.
A road named for the wrong men. The casefile said Kansas City got “roads named after men who helped plan the removal.” The one Kansas City freeway in this file named for a person is Bruce R. Watkins Drive. KCUR reports that Watkins, Kansas City’s first Black council member, was “one of the foremost opponents of the South Midtown Freeway,” and that “In 1986, at Cleaver’s suggestion, the Kansas City Council renamed the highway to Bruce R. Watkins Drive.” The line now reads “Kansas City got maps and grades and acquisition orders,” and a sentence after the list reads “Even so, in 1986 Highway 71 took the name of Bruce R. Watkins, who fought it.”
The surveyors named race. The casefile said “They did not say Black,” and that “The language always cleans itself up when power needs to keep its hands presentable.” The HOLC area-description form had a line headed “Negro,” and the D-24 card printed in this casefile fills it in (“Few mixed”). The D-25 card, which covers 18th Street, describes “the principal negro habitat of Kansas City, MO,” and its Negro line reads “65%.” The sentence now says the form had a line headed Negro, and the line about clean language is cut.
The decline was already under way. The casefile said “The judgment came before the decline,” and that the money would not follow “Not because the buildings were failing. Because Black people were inside them.” The cards describe the buildings: D-24 records “many cheap bungalows and cheaply built 2-story structures,” and D-25 calls its area “that old section where values were ‘shot’ several years ago,” with houses “poorly kept.” The Belvidere Hollow history this casefile cites, published by the Kansas City Public Library and KCHistory, says the neighborhood had declined before the 1942 park approval, and that “landlords didn’t replace or repair buildings for their Black tenants.” “The judgment came before the decline.” is cut, and “Not because the buildings were failing. Because Black people were inside them.” now reads “The cards described the buildings, and they counted the Black residents as part of the risk.”
The map’s effect on lending was stated as settled. The casefile said HOLC grading “locked the map in place. Not just describing the city. Teaching lenders, planners, and insurers how to read it. Money followed the color. So did neglect.” It said of the graded blocks, “Loans don’t arrive.” Economists still dispute how much the maps themselves steered lending. Daniel Aaronson, Daniel Hartley and Bhashkar Mazumder (American Economic Journal: Economic Policy, 2021) compare neighborhoods on either side of the grade lines and find that “The maps led to reduced home ownership rates, house values, and rents and increased racial segregation in later decades,” and say their results “suggest the HOLC maps had meaningful and lasting effects on the development of urban neighborhoods through reduced credit access and subsequent disinvestment.” Price Fishback, Jonathan Rose, Kenneth Snowden and Thomas Storrs (NBER working paper, 2021), working from loan-level data on 1930s HOLC and FHA lending in three cities, Baltimore, Peoria and Greensboro, none of them Kansas City, find that “The FHA’s exclusionary pattern predates the advent of the infamous maps later made by the Home Owners’ Loan Corporation (HOLC) and shows little change after the drafting of those maps. In contrast, the HOLC itself broadly loaned to such neighborhoods and to Black homeowners.” They write: “We conclude that the HOLC’s redlining maps had little effect on the geographic distribution of either program’s mortgage market activity.” “locked the map in place. Not just describing the city. Teaching lenders, planners, and insurers how to read it. Money followed the color. So did neglect.” now reads “wrote the judgment down, block by block. Across the cities they studied, on the lower-graded side of the lines, homeownership, house values and rents fell behind for decades, economists Daniel Aaronson, Daniel Hartley and Bhashkar Mazumder found. Price Fishback and three colleagues, working from 1930s loan records in Baltimore, Peoria and Greensboro, found that the FHA’s exclusion of low-income urban neighborhoods came before the maps, and that the HOLC itself lent in them and to Black homeowners.” “Loans don’t arrive.” is cut.
A publication date the site’s own record does not support. The casefile carried a publication date of February 15, 2025. That date entered its record in later edits, on April 27 and May 19, 2026. The file was first added to this site, already marked published, on April 4, 2026, and the casefile itself cites a KCUR report of April 30, 2025. The publication date now reads April 4, 2026. The 2026-09-27 Correction above gives the earlier date; it is left as it was written.
Smaller changes made at the same time, each quoted as it was and as it now reads:
- “after you spent forty years making it one” now reads “after you made it one.” No dated event in this casefile gives forty years.
- In the Kansas City sequence panel, the dates “1940s–1960s” under Starve and “1960s–1970s” under Name are cut, because no source dates those stages, and “Fund a healing study twenty years later” now reads “Fund a reconnection study.” KCUR describes the federal grant as a project to reconnect the neighborhoods the highway divided.
- “A work of the United States Government.” is cut from the map’s caption. The sheet is printed “COPYRIGHTED GALLUP’S INC.,” a commercial base map with the federal grading laid over it.
- “A new garage.” now reads “A parking garage, open since May 2026.” The city’s Revive the Vine page says the 18th and Lydia garage had its “Grand opening May 22.”
- The docket’s Highway 71 item now adds the 1986 renaming.
- In the image descriptions, “two-storey” now reads “two-story,” “kerb” now reads “curb,” “four colours” now reads “four colors,” and “grades the colours” now reads “grades the colors.”
- “Decay is not the explanation for redlining.” now reads “Decay is not the whole explanation for redlining,” and “The system wounds the neighborhood, then points at the scar as proof the neighborhood was weak.” now reads “The system deepens the wound, then points at the scar as proof the neighborhood was weak.” The cards and the Belvidere Hollow history record decline already under way.
- In the Word Reimagined panel, “fear Black proximity without saying the word Black” now reads “fear Black proximity.”
- The D-24 box adds the card’s Repair line, “Fair to poor,” from the same Mapping Inequality record.
- In the Word of the Week entry, “rather than the houses they lived in” now reads “as well as the houses they lived in.” “Nobody was ever told no. That is the part people miss.” is cut. “The map did the telling.” is cut. “After that the bank did not have to be a racist. The bank only had to be careful, and careful had already been colored in.” is cut.
- The docket adds the two economic studies, each with the words quoted here.
- In the D-24 box, “Infiltration of” now reads “Shifting or Infiltration,” and “Clarifying Remarks” now reads “Description and Characteristics of Area,” the labels printed on the Kansas City form. The file’s internal note no longer calls the box field-for-field.
- “Once that line is drawn, the machine runs itself.” is cut.
- In the map’s image description, “Beneath it:” now reads “Beneath it, in the legend’s words:”, and “prepared by the Division” now reads “prepared by Division,” as the legend prints it. The map’s caption now adds “Base map: Gallup’s Inc., Kansas City, Missouri.” That publisher is printed on the sheet’s title block; the base map was registered for copyright in 1936 and not renewed, and the federal grades drawn over it carry no copyright
Sources: KCUR, “Highway 71 tore through Kansas City’s Black neighborhoods. Can that damage be repaired?” (April 30, 2025); Mapping Inequality, Digital Scholarship Lab, University of Richmond, Greater Kansas City area descriptions D-24 and D-25; Kansas City Public Library and KCHistory, “Belvidere Hollow: KCQ Unearths Kansas City’s Lost Black Neighborhood” (April 18, 2024); National Archives, Record Group 195, NAID 326752026; City of Kansas City, Revive the Vine (page last updated July 24, 2026); Daniel Aaronson, Daniel Hartley and Bhashkar Mazumder, “The Effects of the 1930s HOLC ‘Redlining’ Maps,” American Economic Journal: Economic Policy 13, no. 4 (2021), DOI 10.1257/pol.20190414; Price V. Fishback, Jonathan Rose, Kenneth A. Snowden and Thomas Storrs, “New Evidence on Redlining by Federal Housing Programs in the 1930s,” NBER Working Paper 29244 (2021). Read on September 30, 2026.
DOCKET
- Mapping Inequality. Greater Kansas City HOLC Map — In Kansas City, HOLC neighborhood "risk grading" was mapped and codified in the 1930s–1940s, reinforcing capital denial and disinvestment aligned with race and segregation, shaping the clearance politics that followed.
- Mapping Inequality. Greater Kansas City Context
- Kansas City Public Library. Belvidere Hollow: KCQ Unearths Kansas City's Lost Black Neighborhood — Belvidere Hollow was approved as park space in 1942, removing homes and displacing residents from a Black enclave tied to Exoduster migration.
- KCUR. Parade Park offered Black Kansas City families a share of home ownership. Now it's crumbling — The Attucks neighborhood was cleared through urban renewal in the 1950s, displacing a documented 600-plus families across roughly 54 acres.
- KCUR. Highway 71 tore through Kansas City's Black neighborhoods. Can that damage be repaired? — The U.S. 71 / Bruce R. Watkins Drive corridor was completed in 2001 after decades of planning and property acquisition, with documented destruction of roughly 2,000 homes and displacement of thousands of Black residents. In 1986 the highway was renamed Bruce R. Watkins Drive, for one of the foremost opponents of the South Midtown Freeway.
- City of Kansas City. Revive the Vine — the 2025–2026 reinvestment package combines $400M-plus in public infrastructure and private development. The city page documents the investment; the displacement-pressure reading is WR analysis (on the table), not a claim made by the source.
- Aaronson, Hartley and Mazumder. The Effects of the 1930s HOLC "Redlining" Maps. American Economic Journal: Economic Policy 13(4), 2021, DOI 10.1257/pol.20190414. Abstract: "The maps led to reduced home ownership rates, house values, and rents and increased racial segregation in later decades." "These results suggest the HOLC maps had meaningful and lasting effects on the development of urban neighborhoods through reduced credit access and subsequent disinvestment."
- Fishback, Rose, Snowden and Storrs. New Evidence on Redlining by Federal Housing Programs in the 1930s. NBER Working Paper 29244, 2021: "The FHA's exclusionary pattern predates the advent of the infamous maps later made by the Home Owners' Loan Corporation (HOLC) and shows little change after the drafting of those maps. In contrast, the HOLC itself broadly loaned to such neighborhoods and to Black homeowners." "We conclude that the HOLC's redlining maps had little effect on the geographic distribution of either program's mortgage market activity." Data: every HOLC loan, 1933 to 1936, and every FHA-insured loan, 1935 to 1940, in Baltimore, Peoria and Greensboro.
Cite this file
Word Reimagined, “REDLINE,” WR-FCT-003, https://doi.org/10.5281/zenodo.23075768.
The number is permanent. WR-FCT-003 names this file today and will name the same file in ten years. Add the date you retrieved it.
This file is also deposited with Zenodo, at CERN, under 10.5281/zenodo.23075768. That copy carries the essay whole, its docket and its source ledger, and it outlives this domain.
Trace record
Every claim in this file resolves to a source in the custody ledger.
- Mapping Inequality, Greater Kansas City HOLC Map
Mapping Inequality. Greater Kansas City HOLC Residential Security Map.
archive A
- Mapping Inequality, Greater Kansas City Context
Mapping Inequality. Context essay for the Greater Kansas City redlining survey.
archive A
- Kansas City Public Library, Belvidere Hollow
Kansas City Public Library. 'Belvidere Hollow: KCQ Unearths Kansas City's Lost Black Neighborhood.' April 2024.
article B
- KCUR, Parade Park and Black Home Ownership
KCUR. 'Parade Park offered Black Kansas City families a share of home ownership. Now it's crumbling.' August 10, 2022.
article B
- KCUR, Highway 71 and Bruce R. Watkins Drive
KCUR. 'Highway 71 tore through Kansas City's Black neighborhoods. Can that damage be repaired?' April 30, 2025.
article B
- City of Kansas City, Revive the Vine
City of Kansas City, Missouri. Revive the Vine program overview.
web A
- Aaronson, Hartley and Mazumder, The Effects of the 1930s HOLC "Redlining" Maps
Aaronson, Daniel, Daniel Hartley, and Bhashkar Mazumder. 2021. 'The Effects of the 1930s HOLC "Redlining" Maps.' American Economic Journal: Economic Policy 13 (4): 355-92. DOI: 10.1257/pol.20190414.
article B
- Fishback, Rose, Snowden and Storrs, New Evidence on Redlining by Federal Housing Programs in the 1930s
Fishback, Price V., Jonathan Rose, Kenneth A. Snowden, and Thomas Storrs. 'New Evidence on Redlining by Federal Housing Programs in the 1930s.' NBER Working Paper 29244, September 2021.
article B
Sources are graded A (primary) / B (secondary academic) / C (secondary journalism) / D (tertiary or contested). See the manifesto’s Evidence Standard for full criteria.
File custody
- File
- REDLINE
- Accession
- WR-FCT-003
- Thread
- ERASED
- Status
- published
- Published
- 2026-04-04
- Last updated
- 2026-09-30